

Reports
Know whether Tuesday in Surulere made money after COGS and diesel, not just how busy the till felt.
-
Open Reports
Sidebar Reports (
/reports). Pick Today, 7 days, 30 days, this month, or a custom range.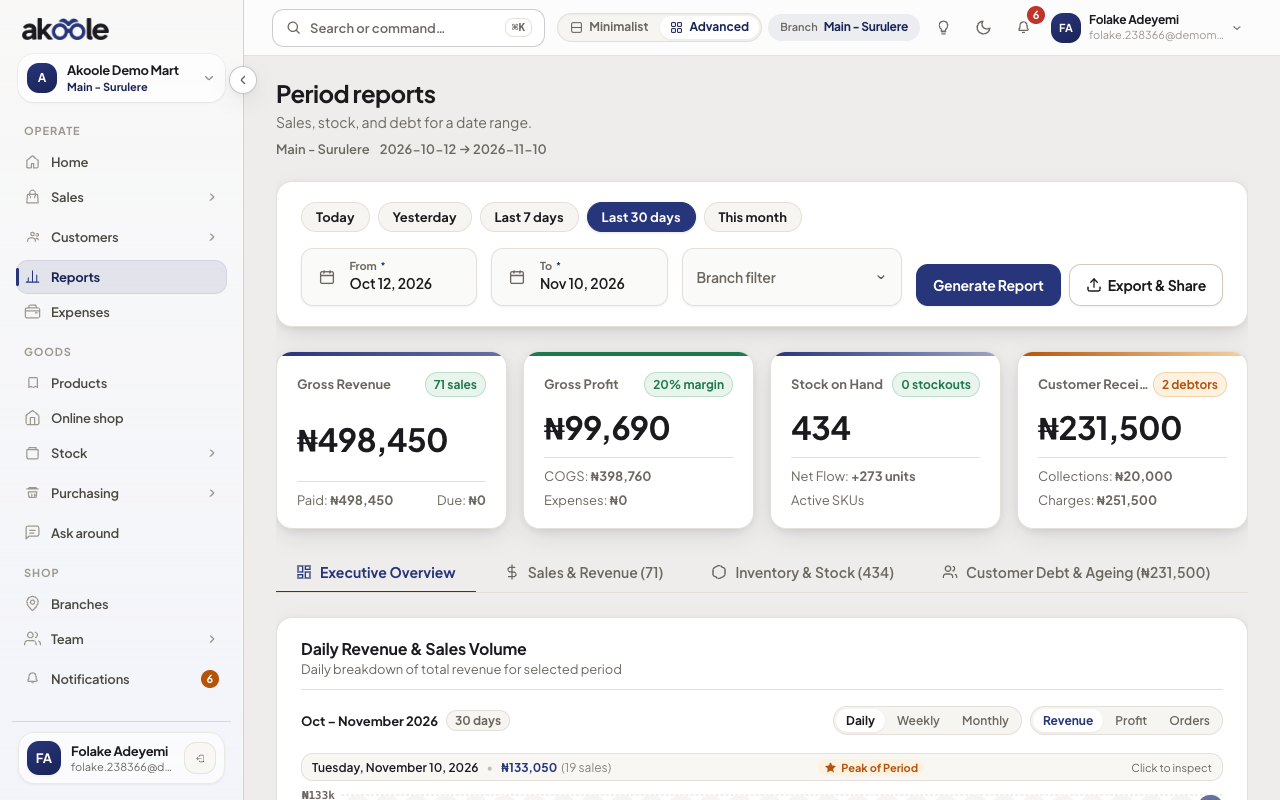
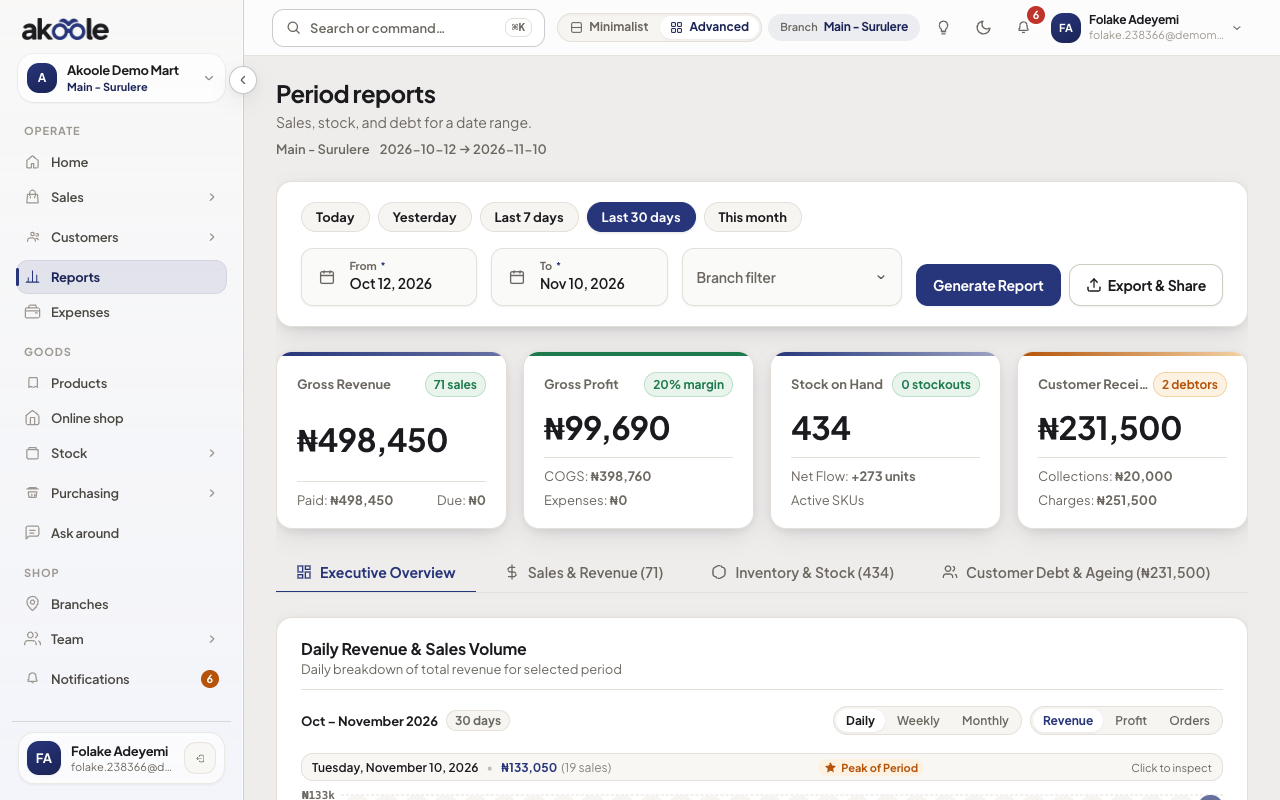
Reports for Main - Surulere with Last 30 days selected -
Read the four KPIs
Gross sales, net profit, average order value, items sold. Hover margin if you need to see how cost vs price moves.
Show screenshot
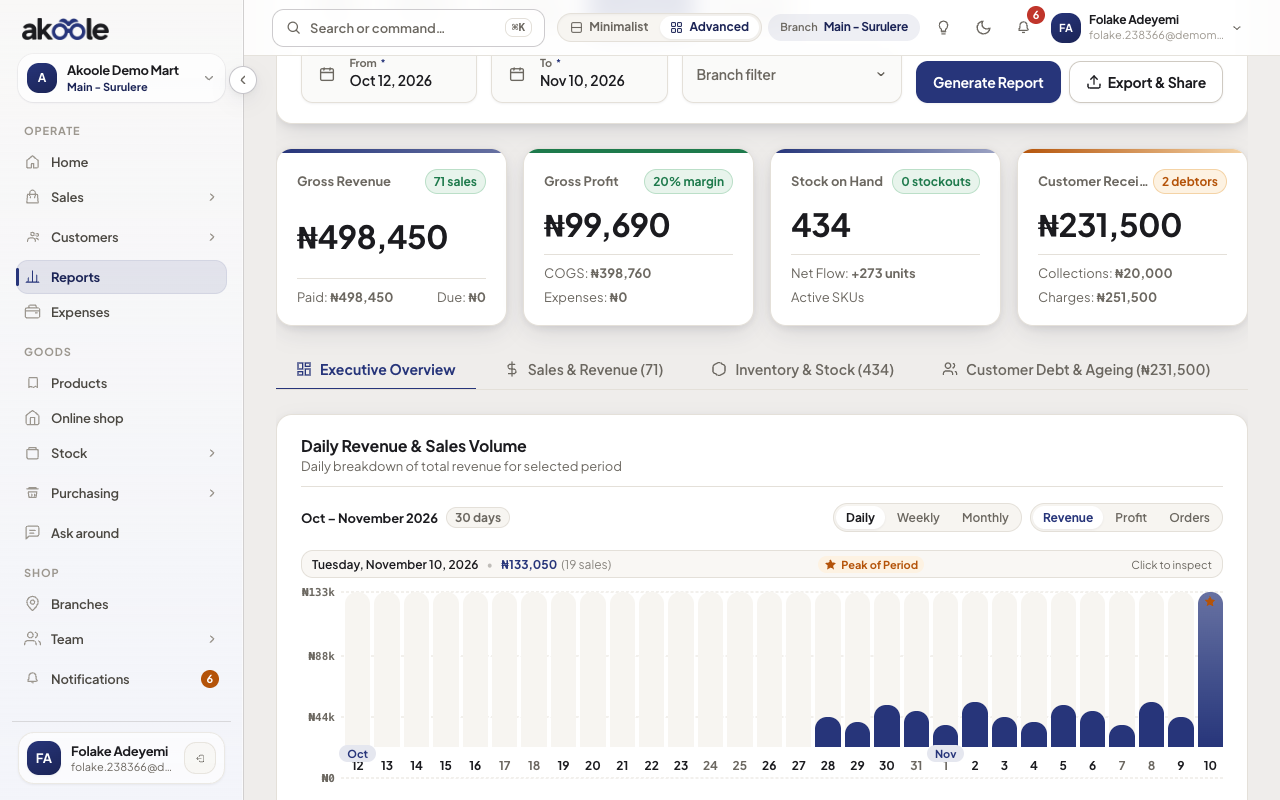
Period reports: revenue, gross profit, stock and receivables -
Staff margin ranking
On the sales tab, Staff margin ranking lists cashiers by gross profit for the period (unit price minus booked cost). Use it after haggling: a till that always sits on the floor will show here. Cashiers never see this page.
Show screenshot
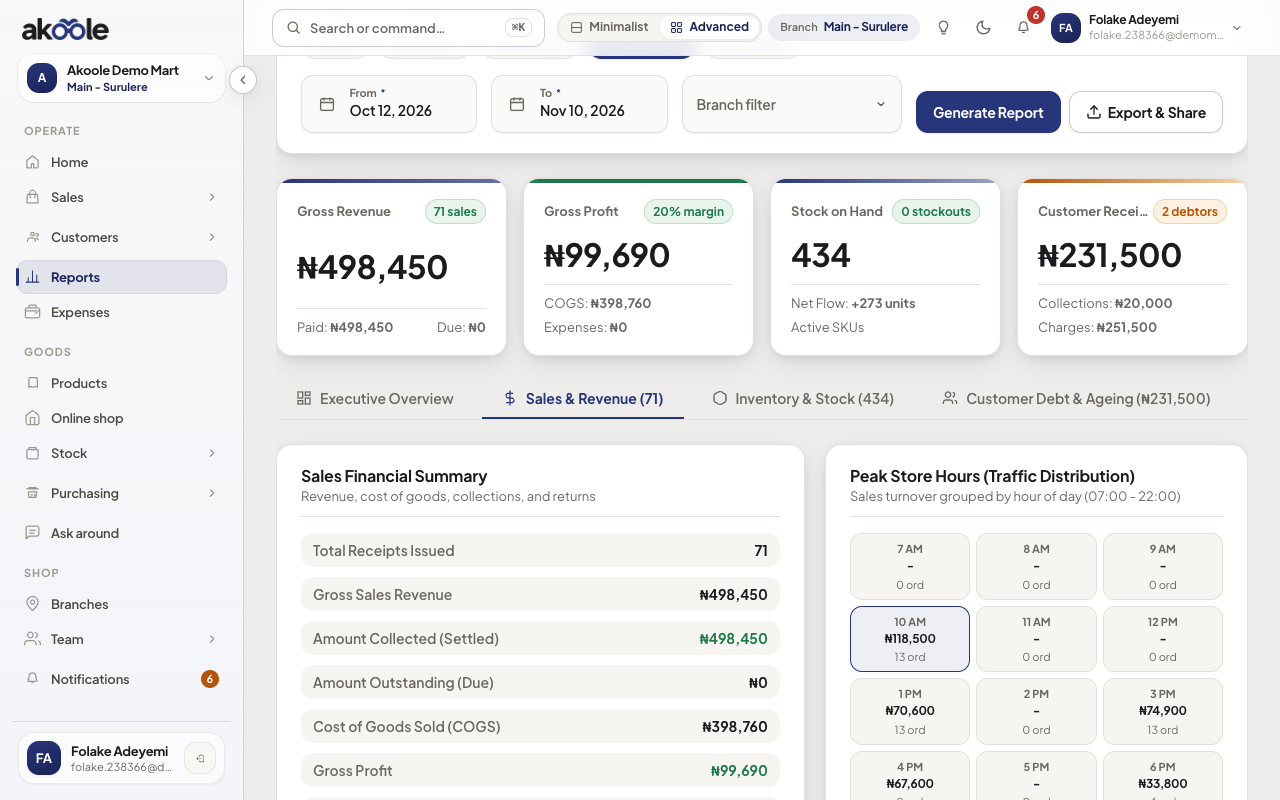
Sales and revenue tab with staff and product performance -
Daily chart
Use the revenue/profit chart to see market days vs Sundays. Staffing follows peak hours.
Show screenshot
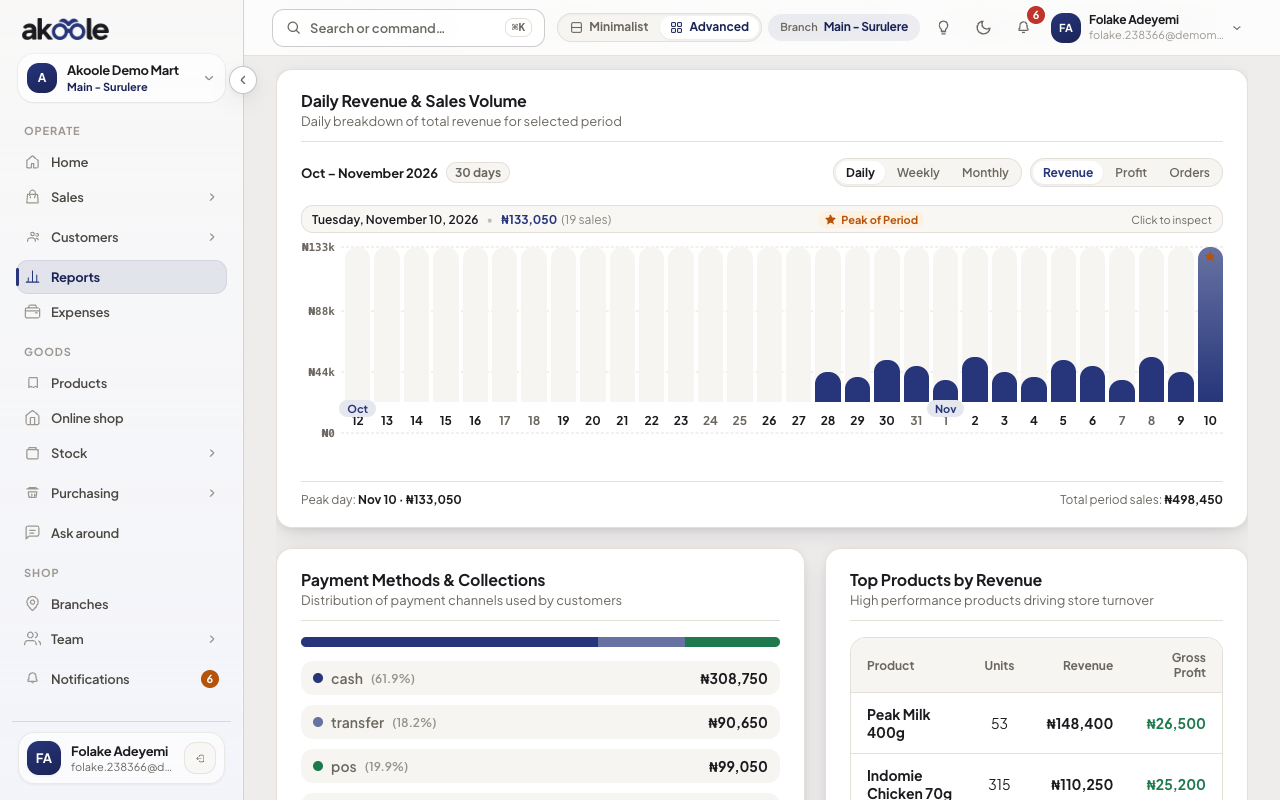
Daily revenue and sales volume for the last 30 days -
Export if the accountant needs a sheet
Export is a separate quota (Starter 2/month, Growth 10). See Export.
Show screenshot
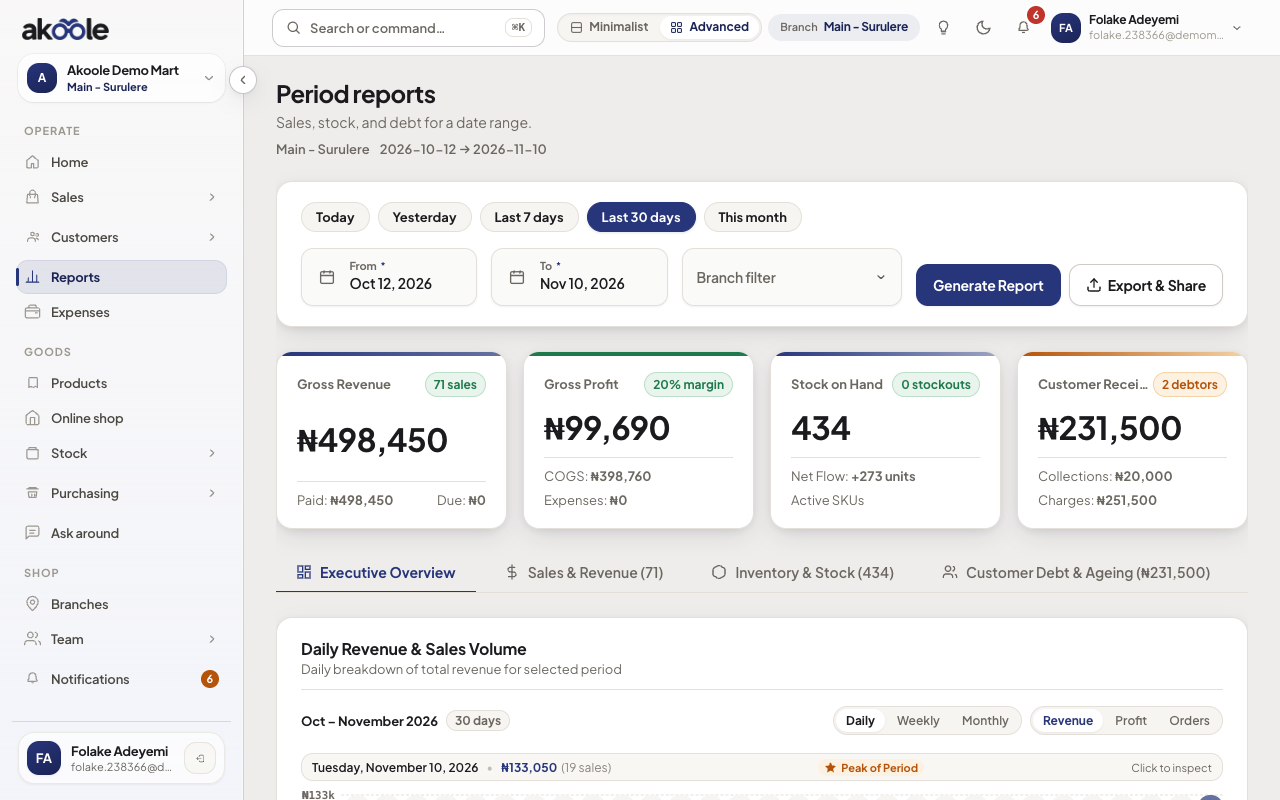
Export and Share in the Reports header
Show screenshot
If something goes wrong
Section titled “If something goes wrong”Net looks huge
Missing expenses or missing cost prices. Fix products and log diesel.
Page forbidden
Cashier preset cannot open reports. Use Owner/Accountant or a custom role.